The VExUS Score: Fluid Status, Reconsidered
Clinical Problem
Proper evaluation of fluid status is imperative to the management and outcome of patients in the emergency department (ED), especially in cases of septic shock, congestive heart failure or acute renal failure. Traditionally, point-of-care ultrasound (POCUS) has been used to assess the inferior vena cava (IVC) for an estimation of fluid status and responsiveness. However, relying exclusively on the IVC diameter and collapsibility has been shown to be insensitive for identifying fluid tolerance in critically ill patients.
Like central venous pressure, estimation of the IVC is not a reliable measure of preload in the left ventricle. The IVC might be dilated in various euvolemic conditions, including pulmonary hypertension and valvulopathies, and it might also be dilated as normal physiologic variance in trained athletes. Another drawback of estimating fluid status only from the IVC is that this ignores the amount of congestion in other vital organs such as the lungs, liver, kidneys and gastrointestinal tract.
Theoretical Construct
Venous congestion can first be appreciated in the IVC: its size increases proportionally to CVP until it reaches its maximum dilation. Pressure is then transmitted in a retrograde fashion through the veins to the abdominal organs.
The Venous Excess Ultrasonography Score (VExUS) is a 4-step protocol that not only evaluates the presence of congestion in the IVC, but also assesses the severity of congestion in three target organs: the liver, the gut and the kidneys. Emergency physicians can easily utilize this protocol to guide fluid management in their patients. For example, a positive VExUS score might suggest conservative fluid administration or lead to the administration of diuretics and vasopressors.

How to Perform a VExUS Exam
In preparation, the patient should lie supine with the head of the bed lowered to 0º and legs bent to relax the abdominal wall. The operator should be positioned on the patient’s right side to facilitate simultaneous scanning and manipulation of the controls. A curvilinear probe will result in a higher resolution of the vessels, but a phased array probe may be used as well. You will need an ultrasound system with color Doppler and pulse wave Doppler capabilities to perform a successful exam.
Step 1 – IVC assessment (B-mode)
Where to look: Place the probe on the patient in the sub-xiphoid location in the sagittal plane. You should see the IVC entering the right atrium. The hepatic vein may be seen entering the IVC.
What to look for: The diameter of the IVC is commonly measured approximately 3-4 cm from the junction of the IVC and the right atrium, or 1-2 cm caudal to the confluence of the hepatic vein and the IVC.
If the diameter is < 2 cm, there is no congestion. If the VExUS score is 0, and you do not need to proceed further.
If the diameter is > 2 cm, congestion is present. Further examination is necessary to determine the severity of congestion and VExUS scores 1-3. This is described in the following steps.
Step 2: Hepatic vein assessment (B-mode, color mode, pulsed wave Doppler mode)
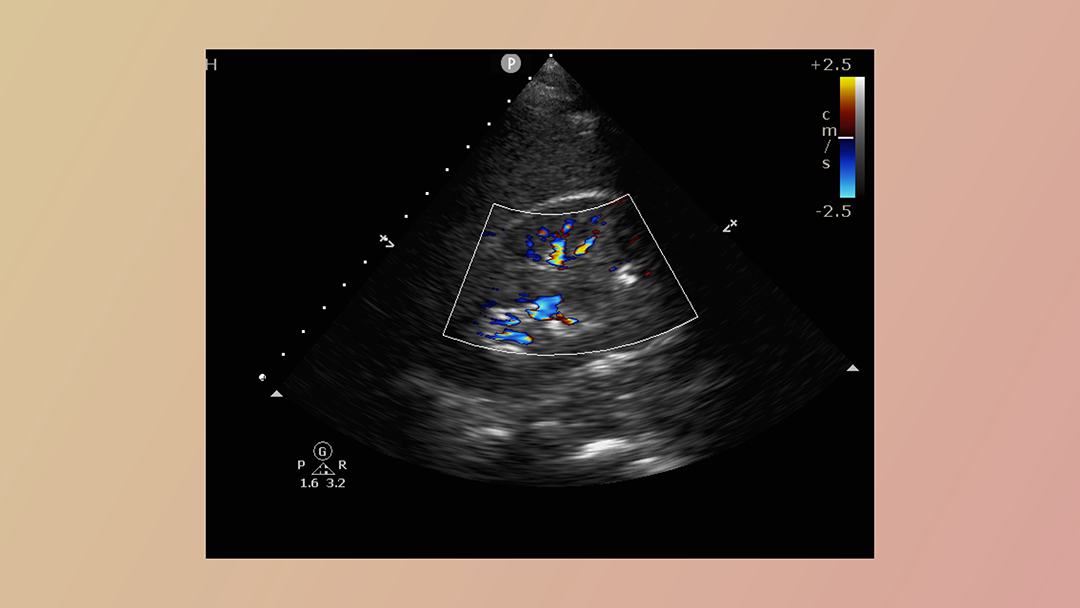
Where to look: Any of the three hepatic veins (right, middle and left) can be evaluated. However, the middle and right hepatic veins are easier to obtain, as they are less likely to be obscured by bowel/stomach gas. First, find the hepatic veins in B-mode. Place your probe in the right upper quadrant, fanning anteriorly and posteriorly. The hepatic veins are thin walled and communicate with the IVC. In the transverse view, the confluence forms the “Playboy Bunny” sign (Fig. 1). Next, assess the vessels with color Doppler. The veins should be blue (flow away from the probe). Finally, place the pulsed wave Doppler gate in the hepatic vein proximal to where it enters the IVC.
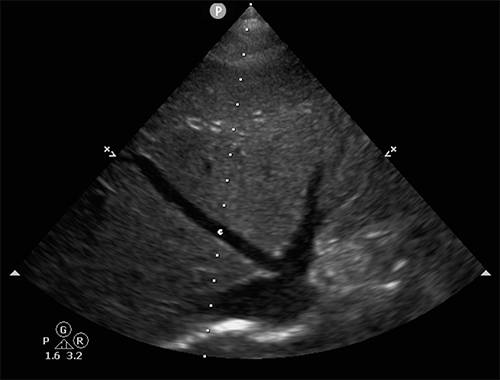
Fig. 1: The confluence of the middle and left hepatic veins enter the IVC to form the “Playboy Bunny” sign.
What to look for: The normal flow pattern in the hepatic veins closely resembles a CVP tracing with three waves: a small retrograde A wave, followed by anterograde S and D waves.
In a healthy patient, the S wave should be much larger in magnitude than the D wave, with both showing negative deflections as blood flows away from the probe.
In the setting of worsening venous congestion, the magnitude of the S wave will decrease as systolic phase venous flow decreases and eventually becomes positive, corresponding to a reversal of blood flow. At this point, venous congestion is severe enough that flow will be away from the IVC, and forward flow will only occur as the ventricle relaxes and fills during diastole.
Limitations: Hepatic vein Doppler is strongly influenced by tricuspid regurgitation, and in these patients, this step may not be suitable.
Step 3: Portal vein assessment (B-mode, color mode, pulsed wave Doppler mode)
Where to look: First, find the hepatic portal veins in the B-mode. Place your probe in the right upper quadrant, mid axillary line, and fan anteriorly and posteriorly. The portal veins are best identified by the presence of thick and hyperechoic walls. Next, assess the vessels with color Doppler. The portal veins should be red (flowing towards the probe). Finally, place the pulsed wave Doppler gate in the hepatic portal vein.
What to look for: Between the GI tract and the liver, the portal system should have constant monophasic flow with minimal variation. As venous congestion increases and pressure from the hepatic veins is transmitted across the hepatocytes into the portal system, the flow becomes pulsatile. The Pulsatility Index quantifies the degree of pulsatility.
Flow-max is measured as the distance between the baseline and the peak of the wave and Flow-min is measured as the distance between the baseline and the trough of the wave. A pulsatility index of less than 30% is normal; between 30 and 49% denotes mild portal vein abnormality; and greater than 50% indicates severe portal vein abnormality.
Step 4: Renal vein assessment (B-mode, color mode, pulsed wave Doppler mode)
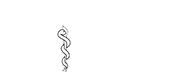
Where to look: First, find the renal veins in the B-mode. Place your probe in the right posterior axillary line. The target vessels are the interlobar or arcuate renal veins located in the renal cortex. Next, assess the vessels with color Doppler (Fig. 2). Finally, since the arteries and veins run antiparallel to each other, the arterial and venous flows can be assessed simultaneously with a single pulsed wave Doppler gate placed over the color signal. Arterial flow will show a positive tracing, while venous flow will show a negative tracing.
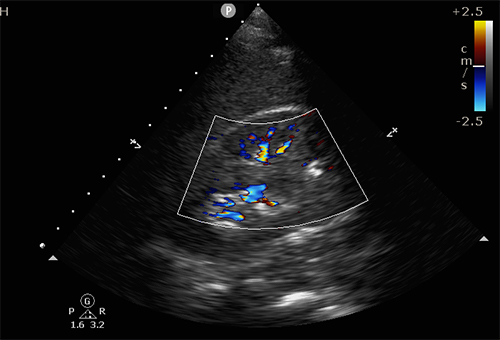
Fig. 2: Color Doppler is used to localize the renal arteries and veins, so that they can next be assessed with the pulsed wave Doppler.
What to look for: Normal renal veins have uninterrupted monophasic flow. As venous congestion increases, the systolic component of the flow decreases. The waveform becomes biphasic, with discrete diastolic and systolic phases. Eventually, in severe congestion there is only diastolic flow, and systolic flow is absent.
Limitation: The difficulty in visualizing the renal vessels might preclude the successful performance of this step.
Scoring and Validation
The VExUS score ranges from Grades 0-3. In Grade 0, a non-dilated IVC (< 2 cm) indicates that no congestion is present. In Grades 1-3, the IVC diameter is > 2 cm. In Grade 1, a dilated IVC and any combination of normal or mildly abnormal flow patterns (but no severe features) indicates mild congestion. In Grade 2, a dilated IVC and one severely abnormal flow pattern indicates moderate congestion. In Grade 3, a dilated IVC and two or more severely abnormal flow patterns indicates severe congestion. Figure 3 depicts normal and severely abnormal pulsed wave Doppler tracings of the hepatic, hepatic portal and renal veins. Figure 4 summarizes the easy to remember VExUS scoring system.
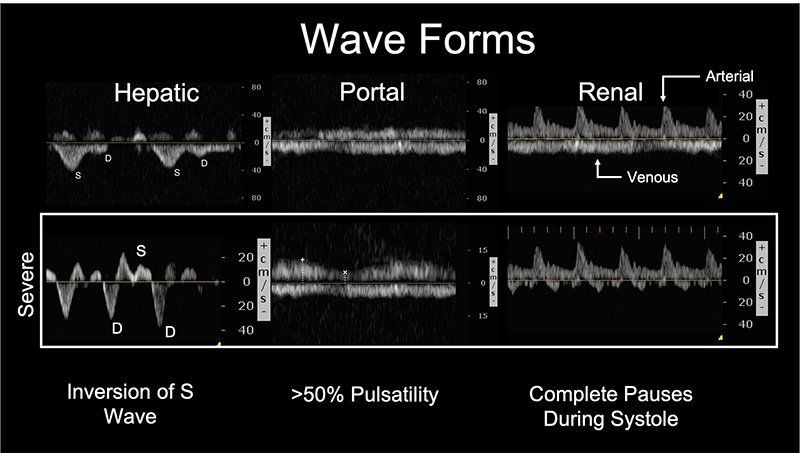
Fig. 3: The upper row depicts normal and the bottom row depicts severely abnormal pulsed wave Doppler tracings of the hepatic, hepatic portal, and renal veins.
The VExUS Grading System
| Grades | IVC | Severely Abnormal Wave Pattern | Venous Congestion |
| 0 | < 2 cm | — | None |
| 1 | > 2 cm | Zero | Mild |
| 2 | > 2 cm | One | Moderate |
| 3 | > 2 cm | Two | Severe |
Fig. 4: The VExUS grading system.
Beaubien-Souligny, et. al [1] recently validated the VExUS grading system in a study that analyzed the risk of acute kidney injury in post-operative cardiothoracic surgery patients. This study used statistical analyses to determine the risk of acute kidney injury associated with normal, mild and severe VExUS grades. In this system, a higher VExUS grade correlated with a higher risk of acute kidney injury. VExUS Grade 3 outperformed traditional CVP measurement in the prediction of acute kidney injury in this patient population. This study suggests that damage to the kidney could result from venous congestion caused by overhydration instead of by hypo-perfusion.
Limitations and Conclusion
The protocol has limitations. Even though it estimates volume status well, the score does not specifically identify the source of venous congestion. It has been recommended that the VExUS score should not be used exclusively, but rather as an adjunct. Emergency physicians still need to clinically assess the patient to determine and correct the underlying causes of venous congestion.
The VExUS score is a powerful tool (Fig. 5), and should be strongly considered for the assessment and management of fluid status in our patients. With its straightforward approach and ease of use, this score is one of the most promising new techniques for the non-invasive assessment of volume status in some of our sickest patients in the emergency department. While current supporting evidence is limited, this technique holds the potential to significantly improve patient outcomes.
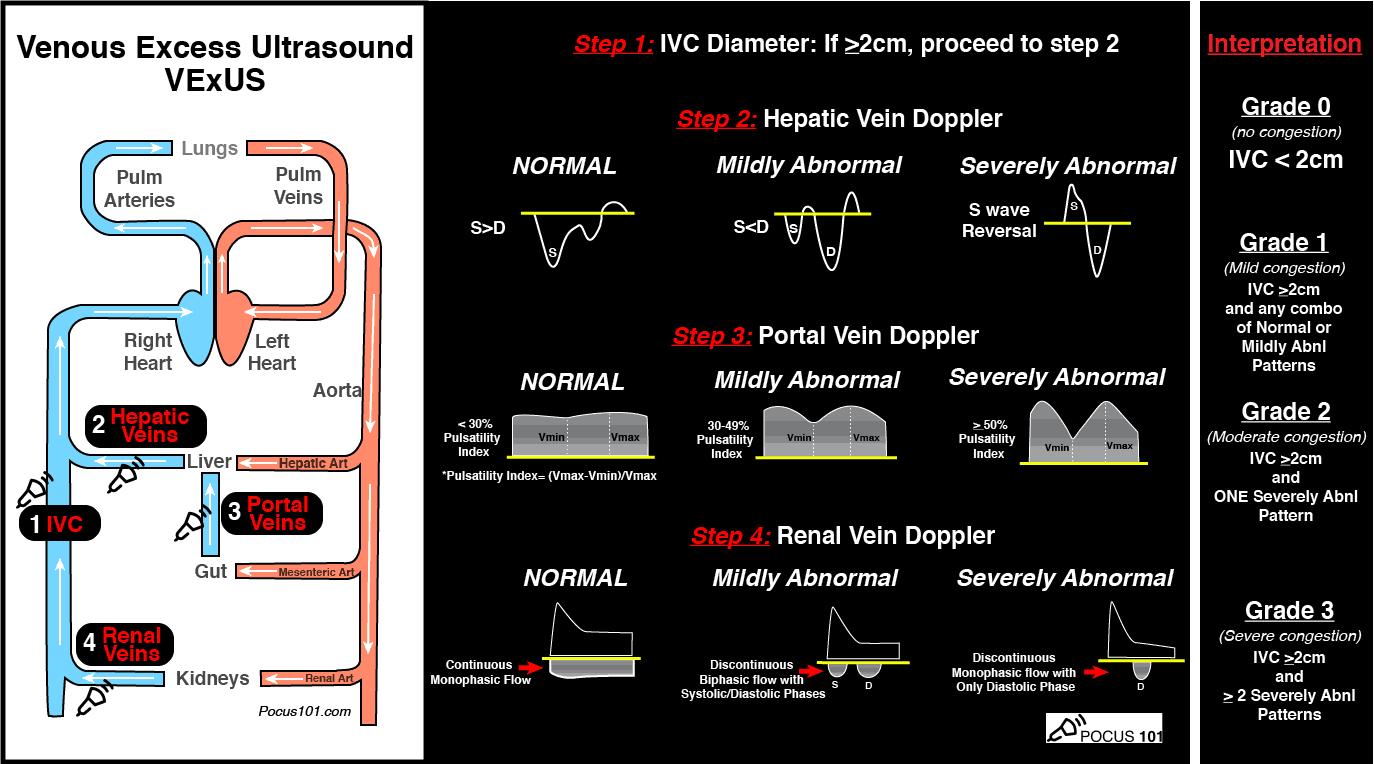
Fig. 5: The VExUS Ultrasound Score Pocket Guide. Reprinted with permission by Dr. Vi Dinh at POCUS101.com. Visit the site to download as PDF.

References:
- Beaubien-Souligny, W., Rola, P., Haycock, K. et al. Quantifying systemic congestion with Point-Of-Care ultrasound: development of the venous excess ultrasound grading system. Ultrasound J 12, 16 (2020). https://doi.org/10.1186/s13089-020-00163-w
- Haycock, K., Spiegel, R., Bedside Ultrasound: A Primer for Clinical Integration, 2nd edition: (2019). Chapter 6, Special Skills: Venous Congestion.
- Weingart, S., &; Rola, P. (2016). EMCrit podcast 263 – the VENOUS side – Part 1 – VEXUS score with Phillipe Rola – emcrit podcast – critical care and resuscitation. Retrieved April 05, 2021.
- Dinh, V. POCUS 101. https://www.pocus101.com/vexus-ultrasound-score-fluid-overload-and-venous-congestion-assessment/
This article is part of the following sections:


