
Ultrasound Zoom: On Cardiac Tamponade
Introduction
As an emergency physician, when I think of diagnosing cardiac tamponade, my mind immediately goes to the traditionally taught Beck’s triad of muffled heart sounds, low blood pressure, and distended neck veins. However, I have learned through experience that muffled heart sounds are difficult to hear in a noisy emergency department, hypotension is not always present, and neck veins are mostly elusive.
A major concern for all emergency physicians is that cardiac tamponade can quickly decompensate into cardiac arrest. While a crash cart situation may sound exciting for some, it is disruptive and unsettling for most healthcare staff and most importantly terrible for the patient.
It is relatively easy to diagnose a pericardial effusion. However, it is extremely difficult to convince consultants that there is an impending tamponade, especially in the face of normal blood pressures. This challenge appears to increase exponentially at night.
How can we convince our consultants to spring out of bed at 3:00 am for a procedure on a patient with stable vital signs? Here is where a systematic cardiac point-of-care ultrasound (POCUS) might just do the trick.
We know POCUS is quick and efficient. A 2017 study on 73 patients compared the diagnosis of tamponade with POCUS to that with CT scans, and demonstrated that POCUS led to decreased pericardiocentesis times (11.3 vs. 70.2 hours, P=0.055) and a shorter length of hospital stay (5.1 vs. 7.0 days, P=0.222). [1]
To diagnose tamponade with POCUS, there are six questions that need careful evaluation. When these six findings are all present on a patient, they should prompt a response even from the most obstinate consultant.
Framework
A phased array transducer should be used to obtain cardiac views and answer the six questions listed below. These views include the inferior vena cava (IVC), parasternal long axis (PSLAX), parasternal short axis (PSSAX), sub-xiphoid (SX), apical four chamber (AP4C), and IVC size and collapsibility. B-mode, M-mode, and pulse wave Doppler modes are useful. The questions that need to be answered to diagnose tamponade are:
- Is there a pericardial effusion, and how big is this?
- Is there right atrial collapse during filling?
- Is there right ventricular collapse during filling?
- Is the inferior vena cava plethoric? What is the collapsibility index?
- Is the respiratory variation of the mitral and tricuspid valve inflow velocities exaggerated?
- Is the direction of blood flow in the hepatic veins reversed?
But first, what is cardiac tamponade? Cardiac tamponade is a syndrome that results from the compression of the heart by a pericardial effusion, which impedes normal cardiac function and results in hemodynamic compromise and obstructive shock.
A normal heart is surrounded by a small amount of physiologic effusion which serves several useful functions, for example lubrication. Several conditions, such as infection, trauma, inflammation, and cancer may lead to the accumulation of larger effusions.
Consider the case of a 26-year-old woman with a history of end stage renal disease who presented to our emergency department with dyspnea. Upon arrival, she was considered “stable” with a heart rate of 88 and blood pressure of 111/92. However, our careful systematic POCUS examination revealed a large pericardial effusion and the looming threat of cardiac tamponade.

Step 1a: Is there a pericardial effusion?
A pericardial effusion appears as a dark, anechoic collection typically surrounding the heart. However, in the setting of dissection, trauma, or cardiac surgery, it may present as a small, localized effusion. Physiological pericardial effusions are usually less than 50 mL and are visualized during systole. If an effusion is appreciated during both systole and diastole, we can assume that it is most likely greater than 50 mL. Additionally, effusions can be categorized as simple or complicated with septations, strings, and floating debris.
Even though a pericardial effusion can be visualized in any of the four standard views, the preferred views to visualize an effusion are the PSLAX (Video 1) and SX (Video 2). On our exam, we found a large, anechoic collection, which dominated every view (Fig. 1a-1b). The heart was seen swinging back and forth in this fluid, aptly called the “swinging heart” sign.
Video 1: Parasternal long axis view: Pericardial effusion
Video 2: Subxiphoid view: Pericardial effusion
Fig. 1a: Parasternal long axis view, B-mode: Pericardial effusion

Fig. 1b: Parasternal short axis view, B-mode: Pericardial effusion

Step 1b: How big is the effusion?
The largest pocket of fluid should be measured at end-diastole from leading edge to leading edge of the pericardial sac. A small effusion is less than 10 mm, a moderate effusion is 10-20 mm, and a large effusion is more than 20 mm. It is important to measure the effusion in multiple views to obtain an overall 3D impression. Our effusion was found to measure 40-50 mm, a large effusion (Fig. 1c, 1d).
Fig. 1c: Apical 4-chamber view, B-mode: Pericardial effusion

Fig. 1d: Subxiphoid view, B-mode: Pericardial effusion

Although size estimation is useful, the rate of fluid accumulation is often more important. Small volume effusions that accumulate quickly can cause a tamponade just as easily as large volume chronic effusions. However, neither the presence nor the absolute size is definitive for the diagnosis of cardiac tamponade, and we must move to Step 2 to assess for tamponade physiology.
Step 2: Does the right atrium collapse?
The right atrium has thin walls and collapses easily. When filling with blood in atrial diastole (ventricular systole), the right atrium should expand. Right atrial collapse in atrial diastole (ventricular systole) is the earliest POCUS finding in tamponade making it sensitive. However, as it may also occur in the absence of tamponade it is not specific. [2]
On our exam, we see this best in our PSSAX view (Fig. 2, Video 3).
Fig. 2: Parasternal short axis view: Pericardial effusion

Video 3: Parasternal short axis view: Pericardial effusion
Step 3: Does the right ventricle collapse?
The right ventricle has thicker walls than the right atrium and collapses less easily. Normally, the atria contract, the valves open, and the ventricles expand and fill with blood. In tamponade, the ventricles collapse due to high pressures exerted by the pericardial effusion. As opposed to right atrial collapse, right ventricular collapse is highly specific (75-90%), but not very sensitive (48-60%) for tamponade. [2] The absence of both right atrial and ventricular collapse during filling has a 90% negative predictive value for tamponade. [2]
Right ventricular collapse in diastole is best visualized in the PSLAX view (freeze and scroll). The timing of mitral valve opening can be used to determine ventricular diastole. In tamponade, when the mitral valve is open, the right ventricular free wall will be seen to collapse (move inwards) (Video 1).
Video 1: Parasternal long axis view: Pericardial effusion
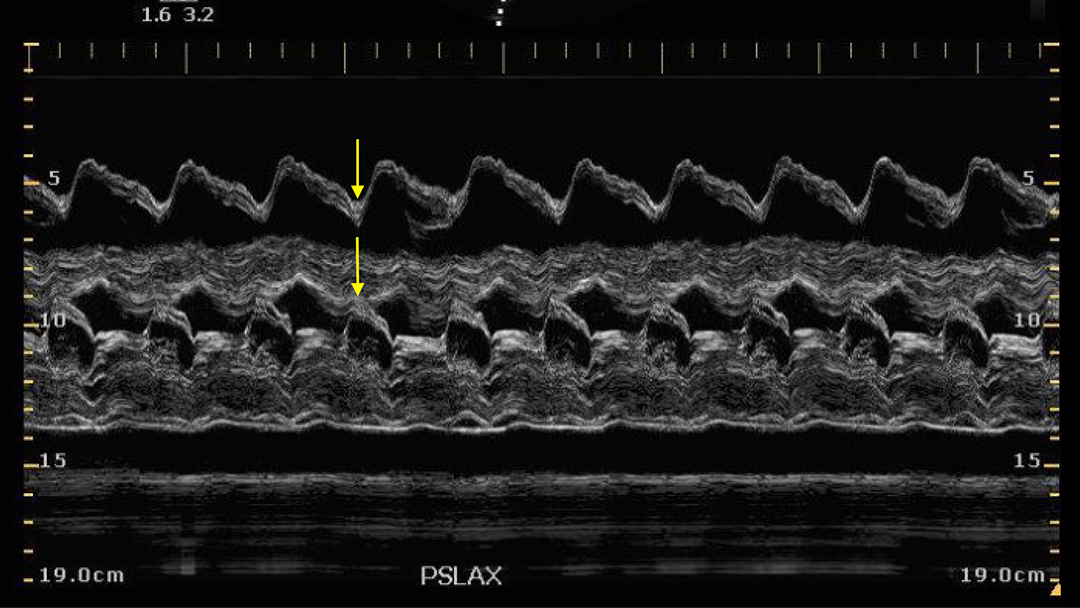
You can also confirm right ventricular collapse using M-mode. In the PSLAX view, the M-mode marker is placed on the mitral valve leaflets to produce the typical E-A pattern. The mitral valve is open at the E-wave. A corresponding dip in the right ventricular free wall at this point suggests ventricular collapse rather than expansion (Fig. 3).
Fig. 3: Parasternal long axis view, M-mode: Right ventricular free wall collapse timed with the E-wave opening of the mitral valve

On our AP4C view both right atrial and right ventricular collapse are seen. This alternating collapse is also known as the “bouncing trampoline” sign (Video 4).
Video 4: Apical 4-chamber view: Pericardial effusion
Step 4a: Is the IVC plethoric?
In cardiac tamponade, right atrial filling is impaired and blood backs up into the IVC, making it plethoric (more than 2.1 cm). This is sensitive (95-97%) but not specific (40%) for cardiac tamponade. Tamponade is associated with minimal (< 50%) respiratory variation. [2] However, if there is > 50% respiratory variation, tamponade is excluded with a 97% specificity. [3]
On POCUS, the IVC is obtained in the sagittal view, and measured 2-3 cm from where the IVC meets the right atrium, or 1cm from where the hepatic vein enters the IVC. In the same sagittal view, M-mode can be utilized to calculate a collapsibility index.
On our exam, our patient was found to have a plethoric IVC with minimal respiratory variation (Fig. 4).
Fig. 4: Inferior vena cava, sagittal view, M-mode: Dilated with minimal respiratory variation

Step 5: Is the pattern of in-flow velocity of the mitral valve normal?
The in-flow velocities of the mitral and tricuspid valves gradually increase and decrease during the respiratory cycle. Analogous to pulses paradoxus, this pattern is exaggerated in cardiac tamponade.
This is best obtained with the pulse wave doppler mode in the AP4C view, in which the blood flow through the valves is roughly parallel to the sound waves. The pulse wave Doppler gate is placed at the tip of the valve leaflets. Several respiratory cycles are captured with a slow sweep speed, adjusted to 25 mm/s. Next, the peak of the highest E-wave and the peak of the lowest E-wave is measured. This can be performed on the mitral and tricuspid valves. A respiratory variation of more than 25% for the mitral valve and more than 40% for the tricuspid valve suggests cardiac tamponade. [2]
On our exam, our patient had a respiratory variation of the in-flow velocity of the mitral valve of greater than 50%, further suggesting the presence of cardiac tamponade (Fig. 5).
Fig. 5: Parasternal long axis view, pulse wave Doppler: Respiratory variation of mitral inflow velocity. Slow speed allows assessment of several respiratory cycles

Step 6. Is the direction of blood flow in the hepatic veins normal?
The impairment of right heart filling leads to a backup of blood and venous congestion. Severe venous congestion, as in cardiac tamponade, can be seen as a reversal of blood flow in the hepatic veins.
The normal flow pattern in the hepatic veins closely resembles a CVP tracing with three waves: a small retrograde A wave, followed by anterograde S and D waves. The S wave should be much larger in magnitude than the D wave with both showing negative deflections, as blood flows away from the probe. In the setting of cardiac tamponade, the magnitude of the S wave will decrease as systolic phase venous flow decreases and eventually becomes positive, corresponding to a reversal of blood flow (Fig. 6).
Fig. 6: Hepatic vein, pulse wave Doppler mode: the upper row depicts normal and the bottom row depicts reversed blood flow in the hepatic veins

Conclusion
Cardiac tamponade is a serious and life-threatening condition that requires prompt attention and intervention, before the patient becomes unstable. Our six-step POCUS framework can assist with making the diagnosis and convincing our consultants that immediate action is needed.
Our patient had the characteristic findings of cardiac tamponade on POCUS: large, circumferential pericardial effusion, right ventricular collapse on filling, right atrial collapse on filling, plethoric IVC with minimal respiratory variation, exaggerated respiratory cycle changes in mitral valve in-flow velocity. An effusion drainage procedure was performed.
Disaster averted with another save by POCUS! Celebrate to the tune of this rap by The EMC.
References
- Alpert EA, Amit U, Guranda L, Mahagna R, Grossman SA, Bentancur A. Emergency department point-of-care ultrasonography improves time to pericardiocentesis for clinically significant effusions. Clin Exp Emerg Med. 2017;4(3):128-132. doi:10.15441/ceem.16.169
- Alerhand S, Carter JM. What echocardiographic findings suggest a pericardial effusion is causing tamponade ? Am J Emerg Med. 2019;37(2):321-326. doi:10.1016/j.ajem.2018.11.004
- Himelman, R. B., Kircher, B., Rockey, D. C., & Schiller, N. B. (1988). Inferior vena cava plethora with blunted respiratory response: a sensitive echocardiographic sign of cardiac tamponade. Journal of the American College of Cardiology, 12(6) 1470–1477. https://doi.org/10.1016/s0735-1097(88)80011-1. No Title.
This article is part of the following sections:


